
Octo Cellularity
Tumour cellularity and tumour–stroma ratio on H&E
Tumour cellularity and tumour–stroma ratio from routine H&E, nucleus by nucleus, before the block goes to sequencing and in the pathology report.
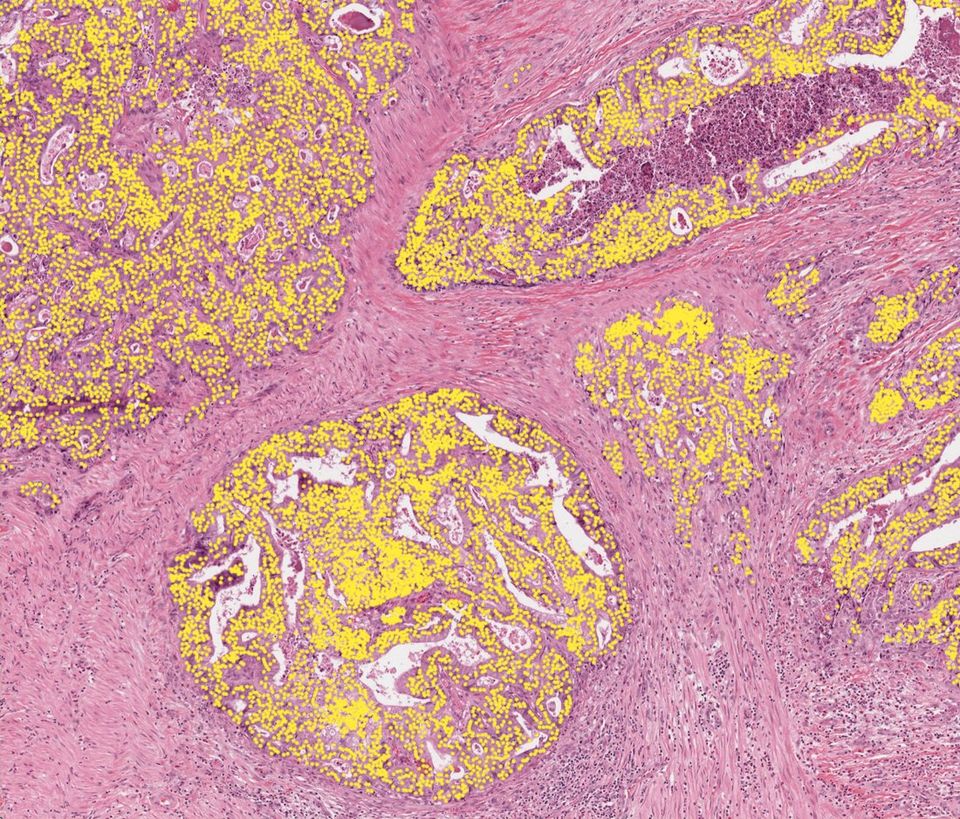
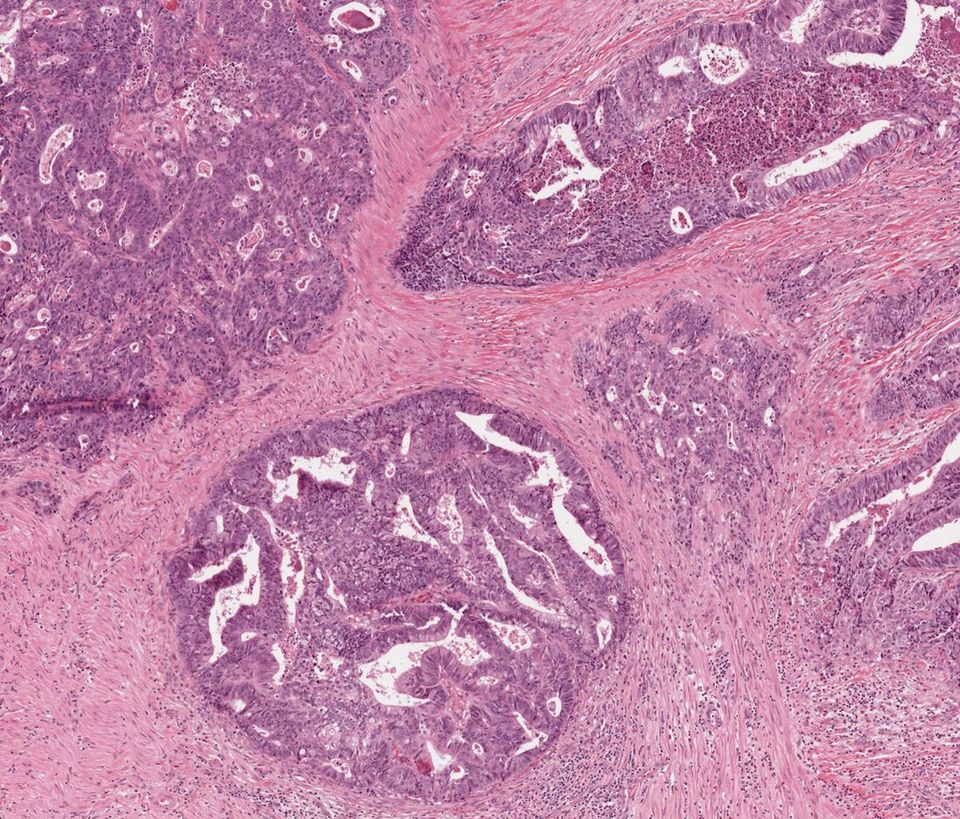
From slide to cellularity result
- 1Scan the blockH&E slide from any scanner
- 2Draw or accept the regionthe area you would macro-dissect
- 3Every nucleus classifiedtumour, stroma, immune, other
- 4Cellularity and TSRwith the region saved alongside
- 5Send to sequencingor into the report
Illustrative proportions.
One cell map. Two answers.
Octo Cellularity classifies every nucleus in the region once. From that single map it reports the tumour fraction for molecular testing and the tumour–stroma ratio for the pathology report.
Cellularity is currently estimated by eye.
Before NGS, someone looks at the H&E and guesses the tumour fraction. Under-called cellularity fails the run; over-called cellularity wastes it, and both delay the patient’s result.
Sequencing depends on the tumour fraction. Sequencing assays need a minimum tumour fraction. A reproducible cellularity, with the region it was measured on, means fewer failed runs and a defensible basis for the choice of block.
For the pathologist
Every nucleus counted
Every nucleus in the region classified as tumour or not, from 14.1 million labelled cells.
Same block, same number
The same percentage for the same block, whoever marks it up and whenever.
The whole region
Whole-region measurement instead of a representative field; region editable by the pathologist.
What you get back
Output | What you get | Format |
|---|---|---|
| Tumour cellularity | percentage of nuclei classified as tumour in the selected region | data |
| Tumour–stroma ratio | stroma as a share of the tumour area, reported as stroma-low or stroma-high | data |
| Tumour cell count | absolute count and density per mm² | data |
| Cell map | every nucleus classified, tumour vs. non-tumour | overlay |
| Region export | coordinates for the macro-dissection template | JSON / PDF |
Tumour cellularity reported as required for molecular testing in RCPath tissue pathways · Reference →
Tumour–stroma ratio reported as required by [guideline name, year] · Reference →
Evidence
Tumour cell density quantified by AI enabled precise chemo-radiotherapy planning in a post-hoc analysis of the ARISTOTLE trial (The Lancet Oncology, 2025). Regulatory status: research use only.
Try Octo Cellularity
Run it on a slide in the platform, or ask for the product sheet with the full output specification.