
Measure the effect.
Trust the precision.
Quantitative biomarker scoring, tumour-microenvironment readouts and custom algorithms for trials and companion-diagnostic programmes — built on Kraken and Nemo, validated with your pathologists.
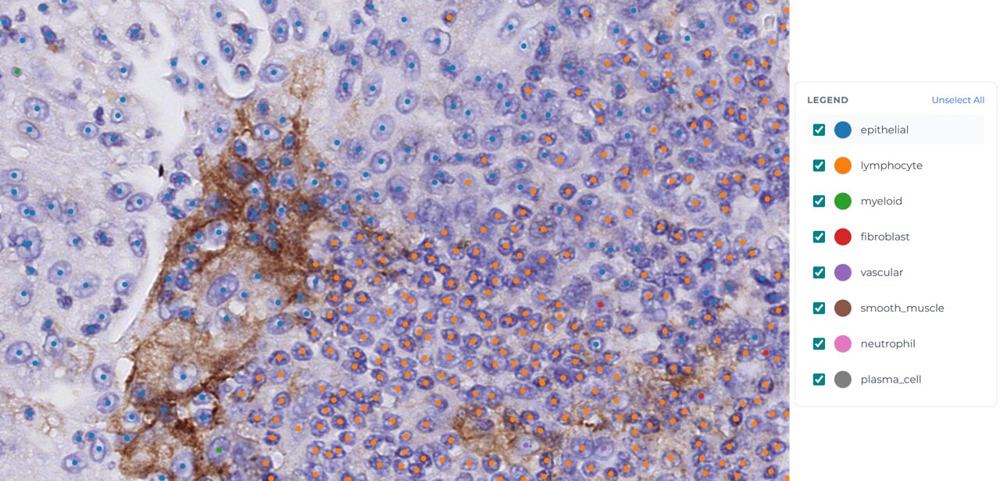 Nemo PD-L1: positive tumour cells, TPS / CPS readout
Services for trial and CDx programmes
Trial biomarker scoring
Any IHC target, not only the four clinical products. Per-cell positivity and intensity, the cut-off the protocol names, and the same read at every site and every time point.
Tumour microenvironment & spatial readouts
Immune infiltrate, stroma ratio, cellularity and cell-to-cell distances from routine H&E — quantitative TME endpoints without an extra stain.
Custom algorithm development
A novel endpoint or a CDx programme: we adapt a foundation model to your cohort, validate it against your reference and hand over the locked algorithm with its evidence.
A direct example: the ARISTOTLE trial
564 patients, median follow-up 78 months. Adding irinotecan to chemo-radiotherapy did not change disease-free survival (three-year 68% against 67%, HR 0.91, p = 0.54) or pathological complete response (19% against 17%), and raised grade 3–5 toxicity from 52% to 78%.
Who irinotecan was for
Mechanistic rationale. Irinotecan only works where it reaches the tumour cell. In rectal cancer, a dense, collagen-rich stroma can act as a physical barrier to drug delivery and limit the fraction of tumour cells a cytotoxic agent reaches. We hypothesised that the balance between the two, how cellular the tumour is against how much collagen-rich stroma surrounds it, would predict who benefits from adding irinotecan: highly cellular tumours with little collagen should respond, collagen-rich tumours should not.
Kraken measured tumour cellularity on the pre-treatment biopsies of 414 patients, as tumour cells over all cells in the tumour and its stroma (tumour cell density, TCD), in about two minutes a slide. The cut-off of 0.5 (not optimised on outcome) was set in advance, without reference to outcome. In cellular tumours, irinotecan cut the risk of recurrence by 43% and of death by half; in collagen-rich tumours it brought toxicity without benefit. Treatment-by-cellularity interaction: DFS HR 0.44, χ² 6.88, p = 0.009; OS HR 0.31, χ² 10.61, p = 0.001.
Kaplan–Meier curves digitised from Figure 3 of the paper, values read from the published figure at monthly intervals. Irinotecan plus chemo-radiotherapy against chemo-radiotherapy alone, within each group. On its own, cellularity did not predict outcome (DFS HR 1.04, p = 0.78): it predicts who responds to irinotecan.
Biomarkers that stand on their own
The immune layer is independent of the irinotecan comparison. From the same Kraken cell map, lymphocyte and macrophage densities are prognostic across both arms: TIL-rich tumours had better outcomes (OS HR 0.42) and macrophage-rich tumours worse, with the effect modified by KRAS and TP53 status.
These associations were then replicated outside ARISTOTLE, in a real-world cohort and in TCGA. They do not rest on a single trial’s result, and they transfer to any programme with an H&E slide: a baseline immune profile for stratification, enrichment or exploratory endpoints, measured on the tissue already collected.
Patients who turned TIL+ after chemo-radiotherapy had a higher pre-treatment mitotic index (mean difference 9.36, 95% CI 1.87–16.85, p = 0.039).
One model, every biomarker, no extra stain
Tumour cells, lymphocytes, macrophages and mitotic figures come out of one Kraken pass over the routine H&E. A completed trial can be re-read in days to find who responded; a running trial can enrich or stratify from the first biopsy; a new trial can carry the readout as an integral biomarker, at every site, with the same model.
Shen Z, et al. Tumour cell density quantified by artificial intelligence is associated with differential benefit from irinotecan-based chemo-radiotherapy in locally advanced rectal cancer: a post-hoc study of the phase 3 ARISTOTLE trial. eBioMedicine 2026; doi 10.1016/j.ebiom.2026.106397
Shen Z, Brand D, Simard M, et al. eBioMedicine 2025;122:105993. doi 10.1016/j.ebiom.2025.105993
Sebag-Montefiore D, et al. Addition of irinotecan to chemoradiotherapy as preoperative treatment for locally advanced rectal cancer (ARISTOTLE). Lancet Oncology 2026.
Immune profiling paper →Tumour cell density paper →Reproducibility across sites and readers
Visual estimation on IHC varies by reader, site and day. A model that counts each cell gives the same number for the same slide, so the effect you measure is the drug’s and not the reader’s.
Every result comes with its overlay and a per-cell export, so an auditor, a regulator or your own pathologist can check the count rather than take it on trust.
Project stages
Scope the endpoint
Target, tissue, cut-off, reference standard and the regulatory path.
Adapt on your cohort
Kraken or Nemo is adapted to your stain, scanner and tissue set.
Validate with your pathologists
Concordance against your readers and reference, documented.
Deploy across sites
Locked algorithm, one read everywhere, per-cell evidence on every slide.
Models and evidence
Kraken
The H&E model behind the Octo products and every H&E readout.
About Kraken →Nemo
The IHC model behind the Nemo products and every IHC score.
About Nemo →Publications & validation
Peer-reviewed work in The Lancet Oncology, eBioMedicine and Nature Communications Biology.
See the evidence →Discuss a programme
Send us the target and tissue and we will run a sample slide from your study.