
Nemo PD-L1
PD-L1 scoring on IHC
PD-L1 scoring across assays: tumour proportion score and combined positive score from per-cell classification.
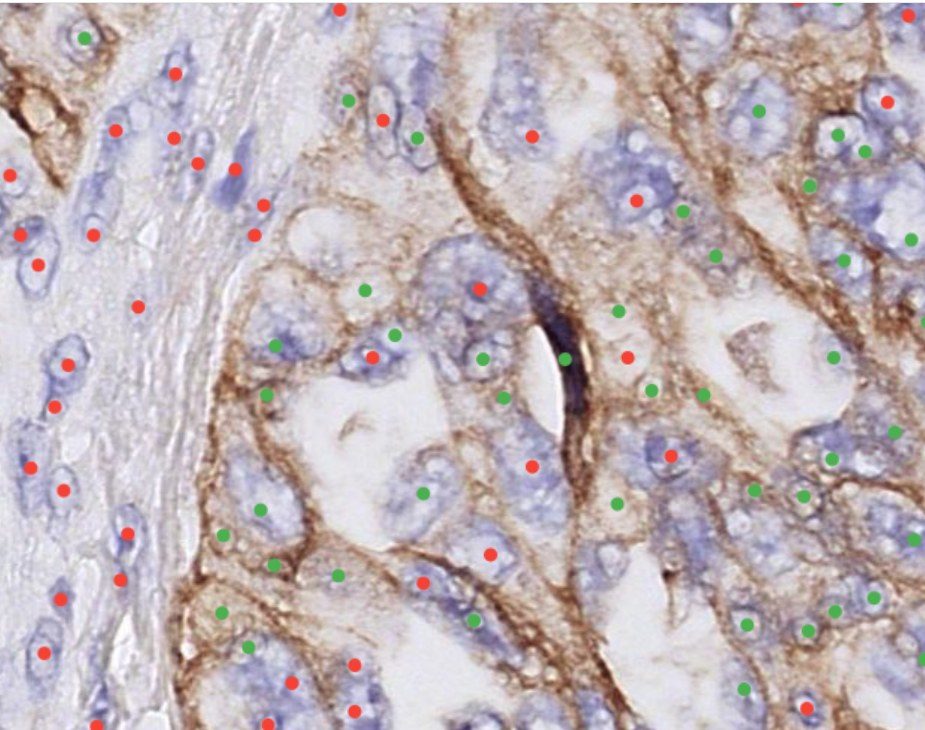
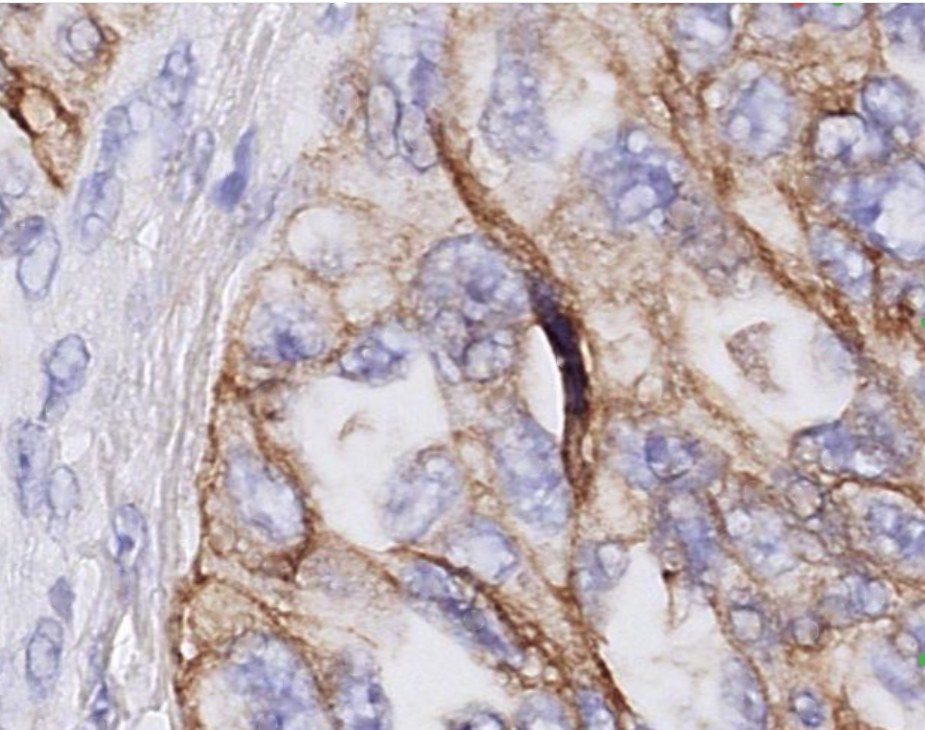
PD-L1 scoring varies between readers
TPS and CPS require counting positive tumour cells and positive immune cells against all viable tumour cells — by eye, across a whole tumour, to a threshold of 1 % or 50 %.
Treatment eligibility depends on the threshold
Immunotherapy eligibility turns on TPS ≥ 1 % or ≥ 50 %, or CPS ≥ 1, 10 or 20. A count places the case on the right side of the line for a reason.
Which cells count, and when
TPS counts PD-L1-positive tumour cells only. CPS adds the positive immune cells. Switch between them to see which cells go into each score.
PD-L1+ tumour cells ÷ viable tumour cells × 100 %
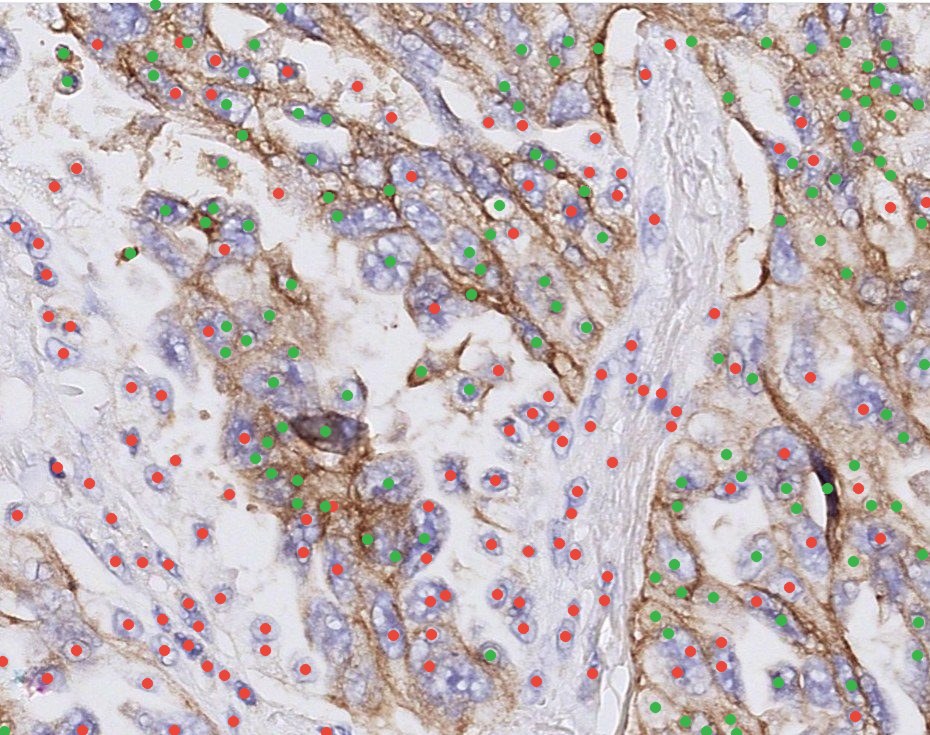 TPS · tumour cells onlyCPS · tumour + immune cells
Three things you stop doing by hand
- 01Tumour and immune, separated
Tumour and immune cells classified and scored for PD-L1 positivity individually.
- 02Same score at every site
Same TPS and CPS for the same slide, every read.
- 03Both scores, one slide
Whole-tumour scoring rather than an estimate over selected fields.
What you get back
datadataoverlayCSV / JSONTPS and CPS calculated per the assay interpretation manual (e.g. PD-L1 IHC 22C3 pharmDx) · Reference →
Validation
Cell detection, per-cell status and TPS on held-out regions.
F1 0.82, just below human agreement
Four pathologists annotated the same regions independently. Nemo agrees with each of them at 0.80–0.83, so it is not fitted to one reader’s habits.
89% agreement with expert calls
5,552 tumour cells across 98 regions.
r = 0.93 with reference TPS, no systematic bias
Agreement on which side of each cut-off a region falls. At 1%, 5% and 10% no region above the threshold was missed (sensitivity 100%); at 1%, specificity is 0.375, so some negative regions are over-called.
Bland–Altman summary: Nemo − reference TPS, in points. Shaded: 95% limits of agreement.
- 2 assays: PD-L1 E1L3N and SP263
- 2 centres, 2 scanner vendors: 3DHISTECH Pannoramic, Roche Ventana iScan
- Public dataset, held-out test split, 4 independent annotators
- Region-level (~1.5 mm), not whole-slide
Try Nemo PD-L1
Run it on a slide in the platform, or ask for the product sheet with the full output specification.