
Nemo HER2
HER2 scoring on IHC
HER2 IHC scoring on the ASCO/CAP scale, from per-cell membrane completeness and intensity.
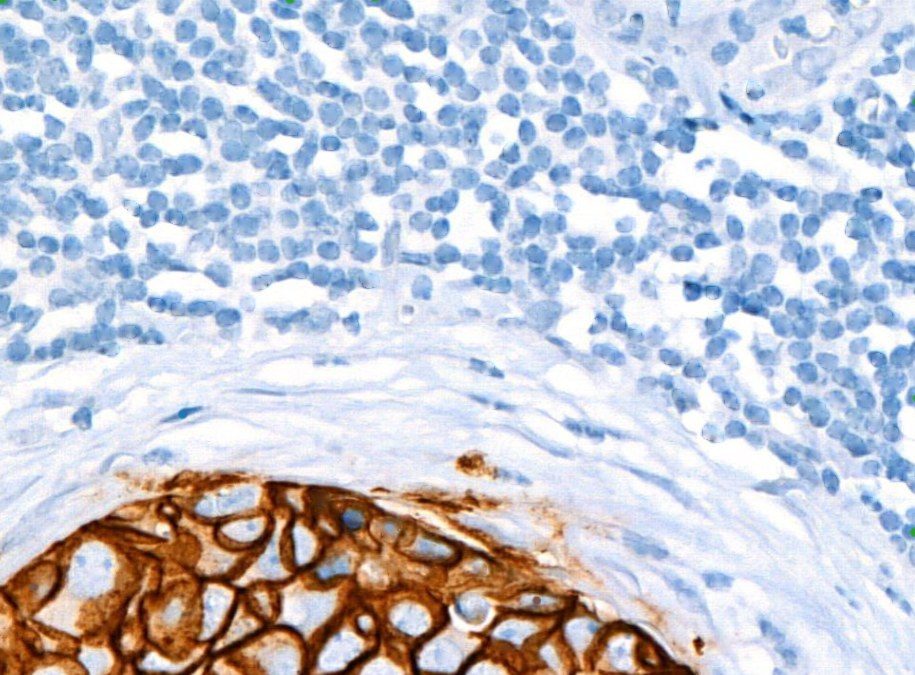
0, 1+, 2+, 3+, and the low in between
HER2-low: IHC 1+, or 2+ without amplification.
Boundary cases are inconsistent.
The 0 / 1+ / 2+ / 3+ categories rest on the fraction of cells with complete, intense membrane staining. The boundary cases go to FISH, and the boundary moves between readers.
HER2-low is now actionable. With HER2-low now actionable, the difference between 0 and 1+ is a treatment decision. A per-cell measurement makes that boundary reproducible.
For the pathologist
Membrane, cell by cell
Membrane completeness and intensity measured per tumour cell.
The boundary, called consistently
Same category for the same slide, with the fraction behind it.
HER2-low flagged
Whole-tumour assessment; heterogeneity mapped rather than averaged.
What you get back
Output | What you get | Format |
|---|---|---|
| HER2 category | 0 / 1+ / 2+ / 3+ per ASCO/CAP [year] with the fraction behind it | data |
| % complete membrane staining | by intensity | data |
| Heterogeneity map | staining category across the tumour | overlay |
| Per-cell export | membrane score per cell | CSV / JSON |
HER2 scored to the ASCO/CAP HER2 testing guideline, including HER2-low categories · Reference →
Validation pilot
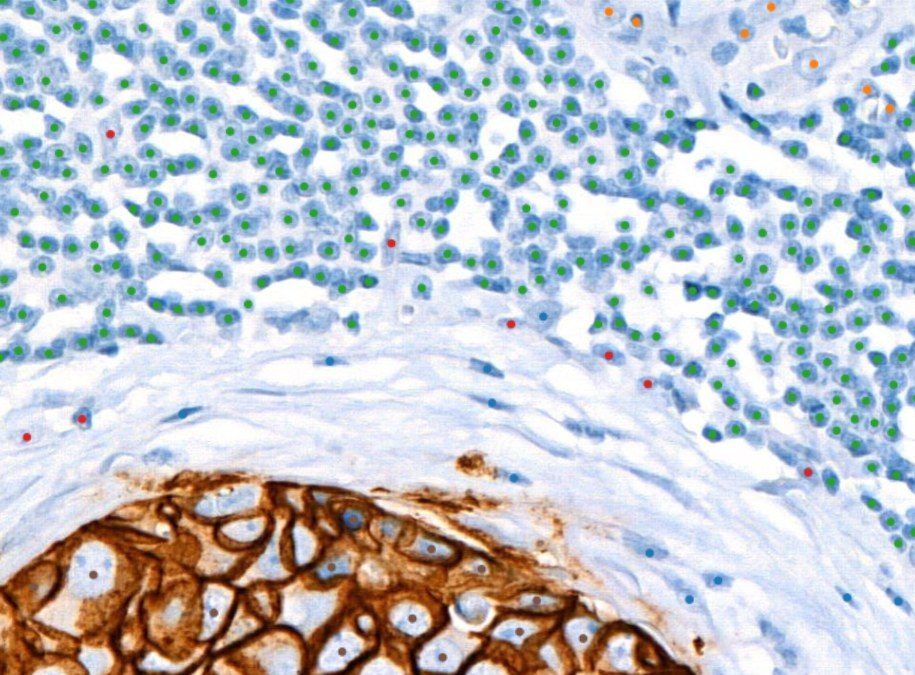
Epithelial cell detection in the tumour region.
Every tumour cell found
Each dot is one cell, from the reported precision and recall. Pilot result.
Try Nemo HER2
Run it on a slide in the platform, or ask for the product sheet with the full output specification.