
Nemo
Every IHC score is a ratio of cells. Nemo detects every cell on the slide, decides whether it is tumour or immune, and reads its stain. Counting all of them, not a few hundred, takes the sampling noise out of the score, on any IHC.
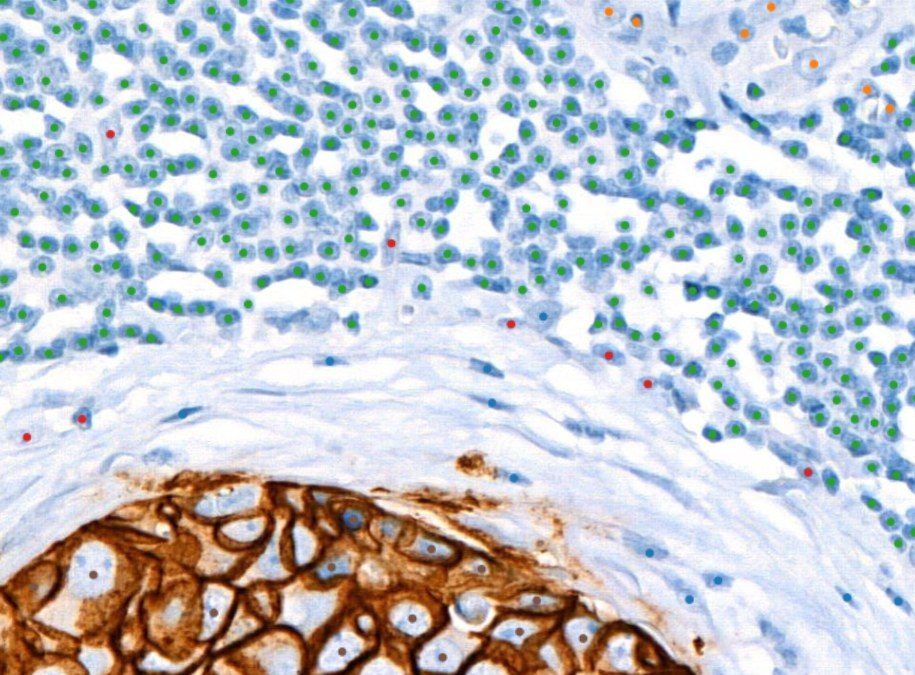
Any IHC. These are the first four products.
Nemo reads the stain, not the marker. Ki67, PD-L1, HER2 and ER/PR are products built on it, each scored the way its guideline defines it; a new marker is a new product, not a new model.
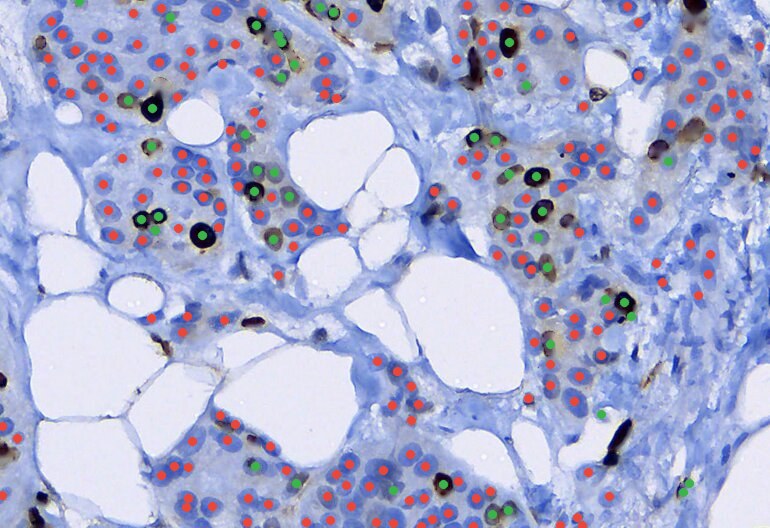
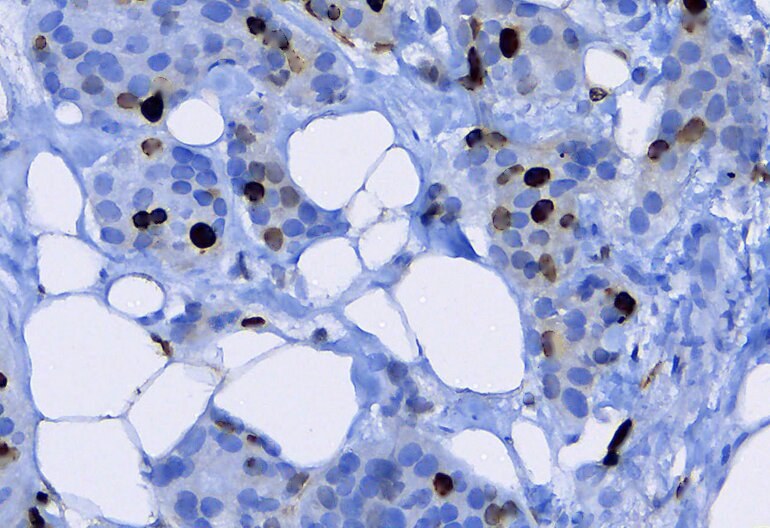
Proliferation index
Positive tumour nuclei ÷ all tumour nuclei, across the whole slide and in the hotspot.
- Ki67 index% of tumour nuclei
- Hotspot indexdensest region
- Nuclei scoredevery tumour cell
Ki67 index scored following the International Ki67 in Breast Cancer Working Group recommendations · Reference →
How Nemo measures up, marker by marker
Held-out data scored against pathologists. Each panel states what was validated and on what, including what has not been validated yet.
F1 0.82, just below human agreement
Four pathologists annotated the same regions independently. Nemo agrees with each of them at 0.80–0.83, so it is not fitted to one reader’s habits.
89% agreement with expert calls
5,552 tumour cells across 98 regions.
r = 0.93 with reference TPS, no systematic bias
Agreement on which side of each cut-off a region falls. At 1%, 5% and 10% no region above the threshold was missed (sensitivity 100%); at 1%, specificity is 0.375, so some negative regions are over-called.
Bland–Altman summary: Nemo − reference TPS, in points. Shaded: 95% limits of agreement.
- 2 assays: PD-L1 E1L3N and SP263
- 2 centres, 2 scanner vendors: 3DHISTECH Pannoramic, Roche Ventana iScan
- Public dataset, held-out test split, 4 independent annotators
- Region-level (~1.5 mm), not whole-slide
F1 0.84 on 210,419 nuclei
Each tile scored against the annotator who labelled it.
Within the spread between people
Tiles labelled by all seven annotators: 3 pathologists, 4 medical students. Nemo scored against each annotator, compared with annotators scored against each other.
- Public dataset (EndoNuke), benign endometrium: 12 patients, 19 slides
- Ventana BenchMark Ultra, CONFIRM anti-ER (SP1) and anti-PR (1E2)
- One scanner, Leica Aperio AT2, at two resolutions
- 7 annotators: 3 pathologists, 4 medical students
- ER/PR positivity scoring: no reference labels in this dataset
- Cell typing in endometrial stroma: 30% of stromal nuclei called stroma, 92% of epithelium correct
Every tumour cell found
Each dot is one cell, from the reported precision and recall. Pilot result.
98.7% of detections are tumour cells
Each dot is one cell, from the reported precision and recall. Pilot result.
Count everything, and the score stops moving
A score from a few hundred cells carries sampling error before anyone makes a mistake: count a different few hundred and you get a different number. Nemo counts every cell, so that error all but disappears, and what is left is the biology.
Range within which the measured index falls 95% of the time, for a true index of 20%. Binomial sampling error only.
Four grades, per cell
A cell is not simply brown or blue. Nemo grades each positive cell 1+, 2+ or 3+, which is what an H-score, an Allred score and a HER2 category need.
H-score = 1 × %1+ + 2 × %2+ + 3 × %3+
Nemo vs marker-specific scorers
Per-cell F1 (×100) on IHC. Higher is better.
Internal benchmark · v2026.06 · subject to regulatory clearance
Every cell on the slide, found and typed
Detections from Compass on IHC slides. Each count is a cell Nemo found and classified; the colours match the overlay in the image.
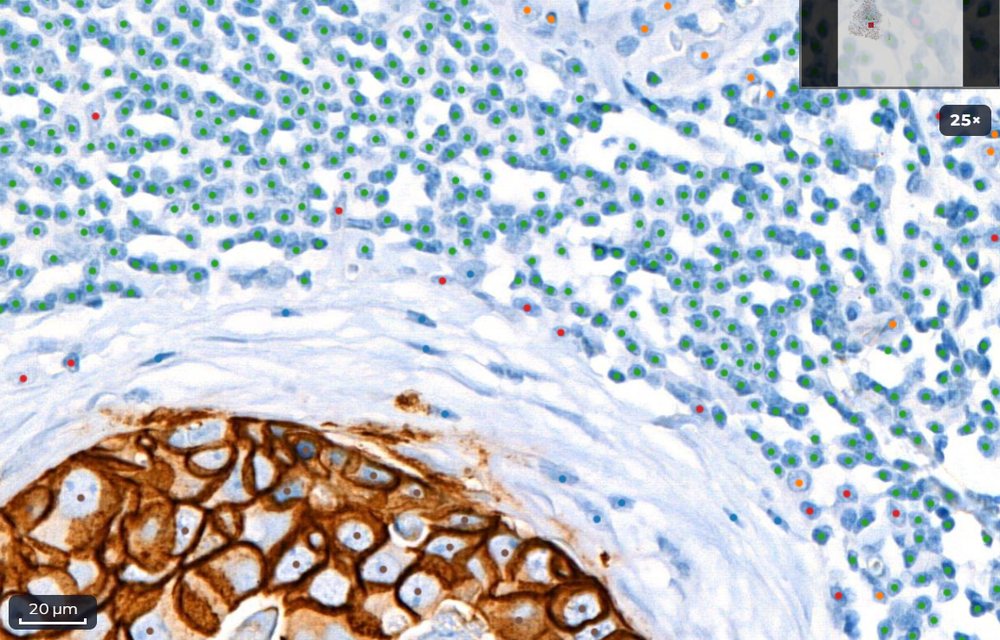
HER2 · 3+ region
- lymphocyte363,12649.8%
- epithelial101,97614.0%
- fibroblast97,66613.4%
- macrophage91,21412.5%
- vascular60,7688.3%
- plasma cell13,4601.8%
- smooth muscle1,3580.19%
- neutrophil1810.02%
Built for companion diagnostics
Trial sponsors use Nemo to score a biomarker the same way at every site, and to test cut-offs retrospectively on the whole cohort. The same model runs in the clinic once the assay is approved.
Put Nemo on your slides.
Request access to run Nemo on your own IHC whole-slide images.